Skip to main content
Go to main navigation
Go to language selector
Search
Free text
Free text
Search
Swedish Match
Menu
Close
Our websites
svenska
Search
Search
Close
Close
Swedish Match websites
Image Bank
Swedish Match Brasil
Swedish Match Industries
Snus and Match Museum
Brand websites
Smokefree
Swedish Match e-commerce service (SE)
General (US)
Longhorn (US)
Pinkerton Tobacco
ZYN (SE)
Lights
Cricket
Nitedals
Redheads
Other
Swedish Match Denmark
Swedish Match Norway
The Solstickan Foundation (SE)
Home
Our company
More
Less
Our company
About us
Markets
More
Less
Our product categories and markets
Company history
More
Less
Svenska Tobaks AB
Svenska Tändsticks AB
Swedish Match AB
Corporate Governance
More
Less
Articles of association
AGM minutes
Our business
More
Less
Our business
Smokefree
More
Less
Nicotine products and regulations
History of snus
Snus production
Cigars
More
Less
History of cigars
Lights
Sustainability
More
Less
Sustainability
Strategy and approach
Materiality assessment
More
Less
Sustainable Tobacco Program
Code of Conduct
More
Less
Supplier Code of Conduct
Swedish Match North America Terms and Conditions
Sustainability information
More
Less
Environment
Compliance
Employees and social conditions
Human rights
Sustainability reporting
Investors
More
Less
Investors
Share holdings
Financial reports
Debt information
More
Less
Debt programs
Outstanding bonds
Media
More
Less
Media
Press releases and news
Swedish Match logotype
Images
Videos
Swedish Match Norway
More
Less
Our history
Sustainability
Media contacts
Snus and health
More
Less
Snus and health
Our standpoint
Swedish Match Scientific Publications
More
Less
Our Scientific Publications
GOTHIATEK
®
More
Less
GOTHIATEK
®
standard
The Swedish Experience
Research on snus
Smoking cessation
Snus and the Swedish Food Act
Nicotine
More
Less
Nicotine labeling of Swedish Match products
Snus, nicotine and nicotine addiction
Tobacco use
More
Less
Tobacco use in figures
Career
More
Less
Career
Employee strategy
Our culture
Work environment
Diversity and non-discrimination
Competence development
Compensation and benefits
Vacant positions
Student
Search
Our websites
Language:
English
svenska
Investors
Share holdings
Financial reports
Debt information
Financial reports
2024
Annual report 2024
Mar 25, 2025 8:09 AM CET
Annual report 2024
2023
Annual report 2023
Jun 28, 2024 12:39 PM CET
Annual report 2023
2022
Annual report 2022
Apr 28, 2023 1:35 PM CET
Annual report 2022
Interim reports 2022
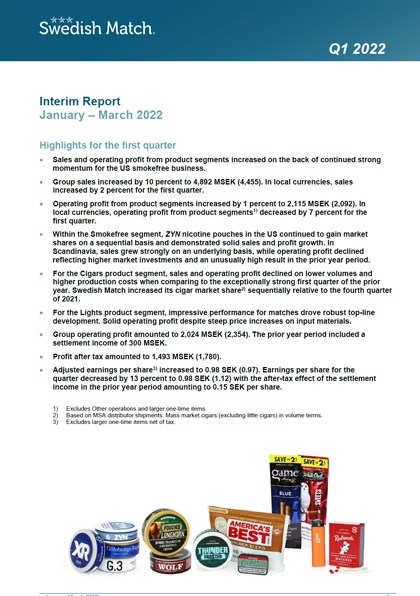
Q1
May 11, 2022 6:15 AM CET
Report
Q2
Jul 22, 2022 6:15 AM CET
Report
Q3
Oct 28, 2022 6:15 AM CET
Report
2021
Annual report 2021
Mar 25, 2022 10:00 AM CET
Overview page 2021
Annual report 2021
Annual report 2021 (ESEF)
Annual report 2021 XBRL viewer
Interim reports 2021
Q1
Apr 30, 2021 6:15 AM CET
Report
Q2
Jul 20, 2021 6:15 AM CET
Report
Q3
Oct 27, 2021 6:15 AM CET
Report
Q4
Feb 16, 2022 7:15 AM CET
Report
2020
Annual report 2020
Mar 16, 2021 2:00 PM CET
Overview page 2020
Annual report 2020
Interim reports 2020
Q1
Apr 27, 2020 6:15 AM CET
Report
Q2
Jul 17, 2020 6:15 AM CET
Report
Q3
Oct 27, 2020 7:15 AM CET
Report
Q4
Feb 10, 2021 7:15 AM CET
Report
2019
Annual report 2019
Mar 6, 2020 1:03 PM CET
Overview page 2019
Annual report 2019
Interim reports 2019
Q1
May 9, 2019 6:15 AM CET
Report
Q2
Jul 18, 2019 6:15 AM CET
Report
Q3
Oct 25, 2019 6:15 AM CET
Report
Q4
Feb 12, 2020 7:15 AM CET
Report
2018
Annual report 2018
Mar 18, 2019 10:00 AM CET
Overview page 2018
Annual report 2018
Interim reports 2018
Q1
May 4, 2018 6:15 AM CET
Report
Q2
Jul 19, 2018 6:15 AM CET
Report
Q3
Oct 26, 2018 6:15 AM CET
Report
Q4
Feb 13, 2019 7:15 AM CET
Report
2017
Annual report 2017
Mar 19, 2018 2:30 PM CET
Overview page 2017
Annual report 2017
Interim reports 2017
Q1
May 8, 2017 6:15 AM CET
Report
Q2
Jul 21, 2017 6:15 AM CET
Report
Q3
Oct 27, 2017 6:15 AM CET
Report
Q4
Feb 14, 2018 7:15 AM CET
Report
2016
Annual report 2016
Mar 24, 2017 10:30 AM CET
Annual report 2016
Interim reports 2016
Q1
May 4, 2016 6:15 AM CET
Report
Q2
Jul 22, 2016 6:15 AM CET
Report
Q3
Oct 28, 2016 6:15 AM CET
Report
Q4
Feb 17, 2017 7:15 AM CET
Report
2015
Annual report 2015
Mar 24, 2016 9:30 AM CET
Annual report 2015
Interim reports 2015
Q1
May 8, 2015 6:15 AM CET
Report
Q2
Jul 17, 2015 6:15 AM CET
Report
Q3
Nov 4, 2015 7:15 AM CET
Report
Q4
Feb 19, 2016 7:15 AM CET
Report
2014
Annual report 2014
Mar 20, 2015 2:00 PM CET
Annual report 2014
Interim reports 2014
Q1
May 9, 2014 6:15 AM CET
Report
Q2
Jul 18, 2014 6:15 AM CET
Report
Q3
Oct 24, 2014 6:15 AM CET
Report
Q4
Feb 18, 2015 7:15 AM CET
Report
2013
Annual report 2013
Mar 25, 2014 1:31 PM CET
Annual report 2013
Interim reports 2013
Q1
Apr 29, 2013 6:15 AM CET
Report
Q2
Jul 19, 2013 6:15 AM CET
Report
Q3
Oct 29, 2013 7:15 AM CET
Report
Q4
Feb 19, 2014 7:15 AM CET
Report
2012
Annual report 2012
Mar 25, 2013 3:00 PM CET
Annual Report 2012
Interim reports 2012
Q1
May 4, 2012 6:15 AM CET
Report
Q2
Jul 20, 2012 6:15 AM CET
Report
Q3
Oct 30, 2012 7:15 AM CET
Report
Q4
Feb 20, 2013 7:15 AM CET
Report
2011
Annual report 2011
Mar 30, 2012 11:00 AM CET
Annual Report 2011
Interim reports 2011
Q1
May 4, 2011 6:00 AM CET
Report
Q2
Jul 20, 2011 6:00 AM CET
Report
Q3
Oct 26, 2011 6:01 AM CET
Report
Q4
Feb 22, 2012 7:16 AM CET
Report
2010
Annual report 2010
Apr 4, 2011 7:57 AM CET
Annual report 2010
Interim reports 2010
Q1
Apr 29, 2010 6:01 AM CET
Report
Q2
Jul 21, 2010 6:00 AM CET
Report
Q3
Oct 27, 2010 6:01 AM CET
Report
Q4
Feb 23, 2011 7:01 AM CET
Report
2009
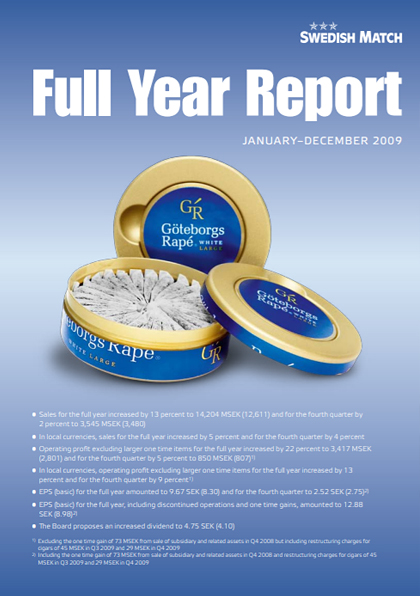
Annual report 2009
Mar 31, 2010 1:26 PM CET
Annual report 2009
Interim reports 2009
Q1
Apr 30, 2009 6:02 AM CET
Report
Q2
Jul 17, 2009 6:01 AM CET
Report
Q3
Oct 27, 2009 7:00 AM CET
Report
Q4
Feb 25, 2010 7:01 AM CET
Report
2008
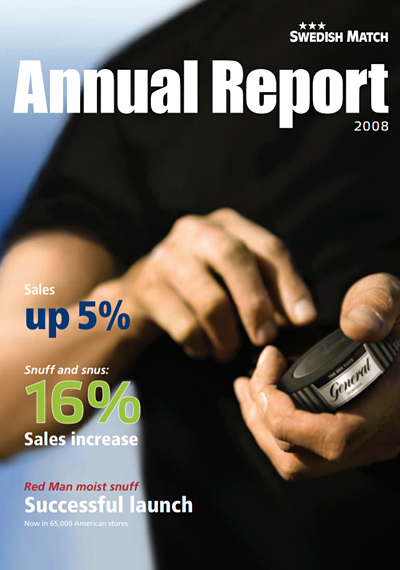
Annual report 2008
Apr 1, 2009 9:18 AM CET
Annual report 2008
Interim reports 2008
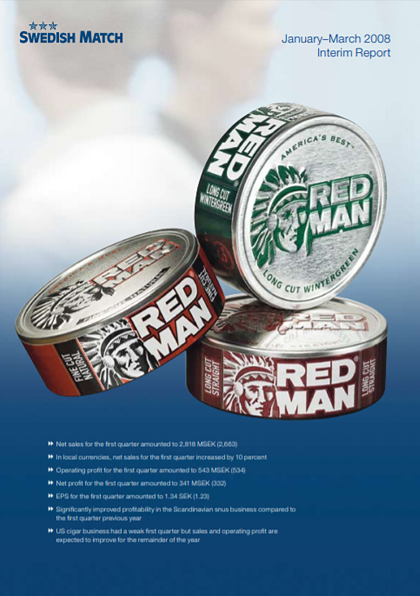
Q1
Apr 25, 2008 9:49 AM CET
Report
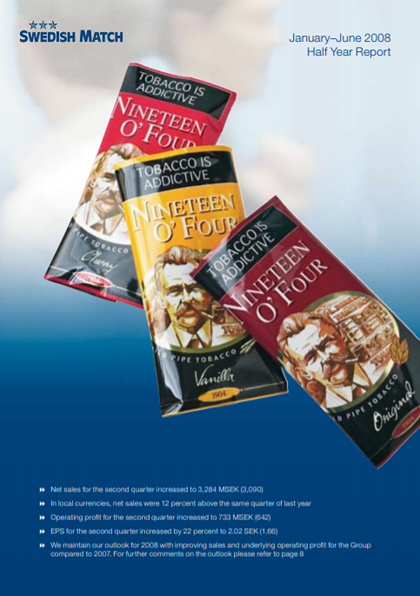
Q2
Jul 18, 2008 6:01 AM CET
Report
Q3
Oct 29, 2008 7:21 AM CET
Report
Q4
Feb 18, 2009 7:03 AM CET
Report
2007
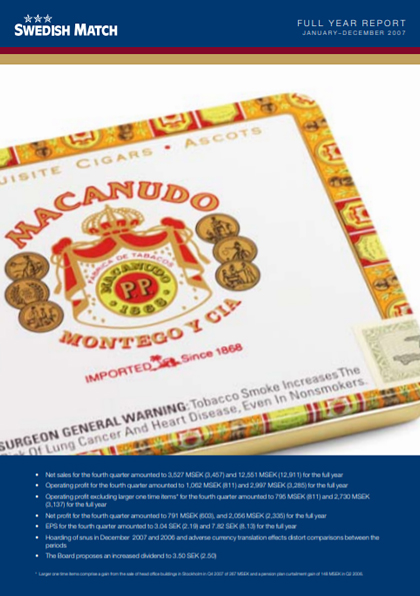
Annual report 2007
Apr 2, 2008 10:06 AM CET
Annual report 2007
Interim reports 2007
Q1
Apr 27, 2007 6:51 AM CET
Report
Q2
Jul 20, 2007 6:11 AM CET
Report
Q3
Oct 25, 2007 6:41 AM CET
Report
Q4
Feb 20, 2008 7:00 AM CET
Report
2006
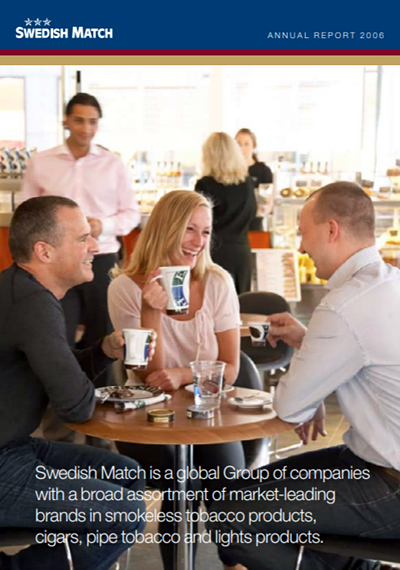
Annual report 2006
Mar 22, 2007 3:32 PM CET
Annual report 2006
Interim reports 2006
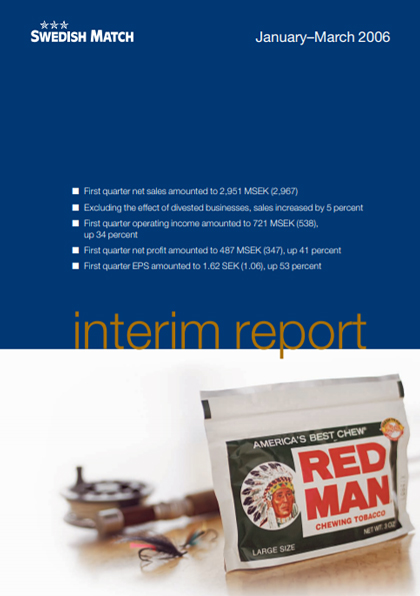
Q1
Apr 28, 2006 8:55 AM CET
Report
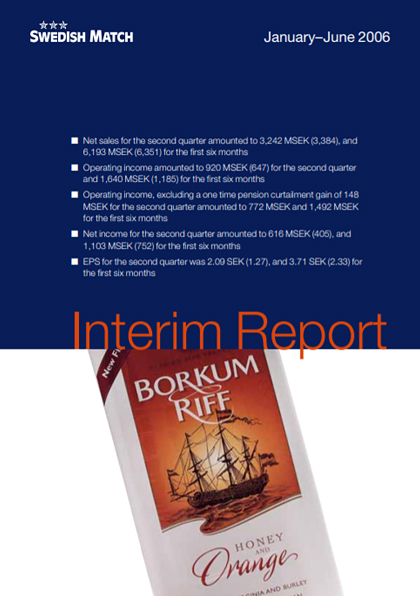
Q2
Aug 3, 2006 6:46 AM CET
Report
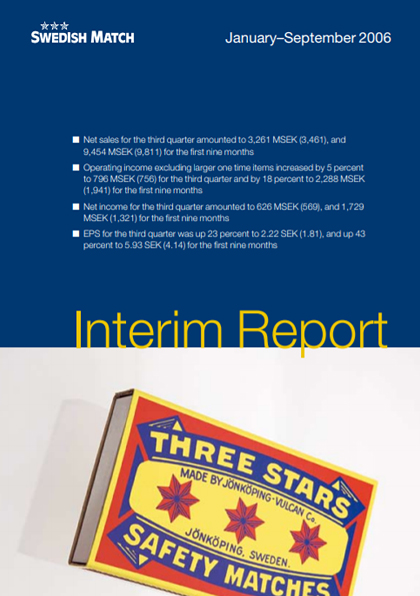
Q3
Oct 25, 2006 6:33 AM CET
Report
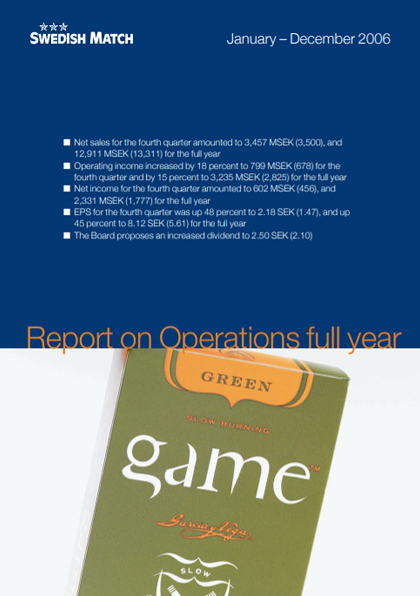
Q4
Feb 14, 2007 7:51 AM CET
Report
2005
Annual report 2005
Mar 28, 2006 10:01 AM CET
Annual report 2005
Interim reports 2005
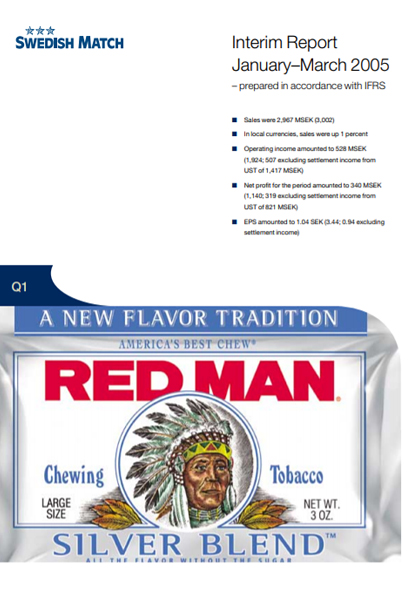
Q1
Apr 20, 2005 9:07 AM CET
Report
Q2
Jul 21, 2005 6:47 AM CET
Report
Q3
Oct 25, 2005 9:22 AM CET
Report
Q4
Feb 15, 2006 9:44 AM CET
Report
2004
Annual report 2004
Apr 4, 2005 8:08 AM CET
Annual report 2004
Interim reports 2004
Q1
Apr 26, 2004 8:58 AM CET
Report
Q2
Jul 21, 2004 9:20 AM CET
Report
Q3
Oct 26, 2004 9:10 AM CET
Report
Q4
Feb 11, 2005 11:09 AM CET
Report
2003
Annual report 2003
Apr 19, 2004 9:26 AM CET
Annual report 2003
Interim reports 2003
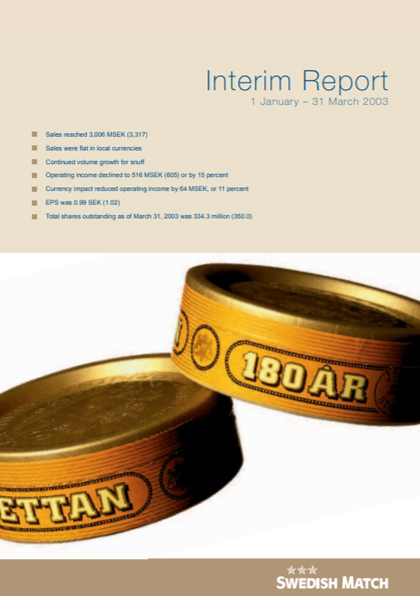
Q1
Apr 25, 2003 9:46 AM CET
Report
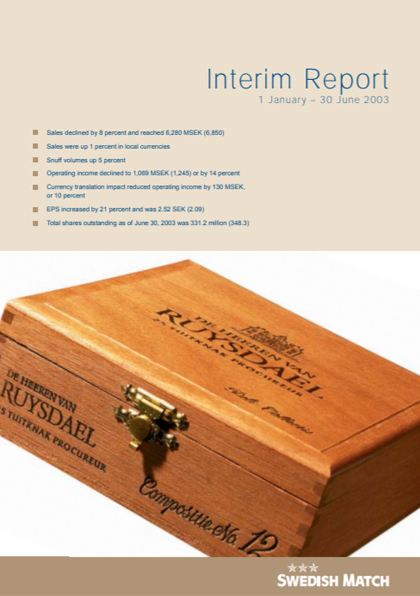
Q2
Jul 23, 2003 10:01 AM CET
Report
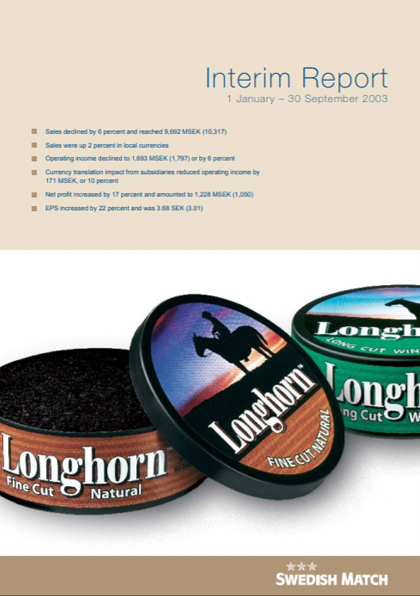
Q3
Oct 23, 2003 9:18 AM CET
Report
Q4
Feb 11, 2004 10:40 AM CET
Report
2002
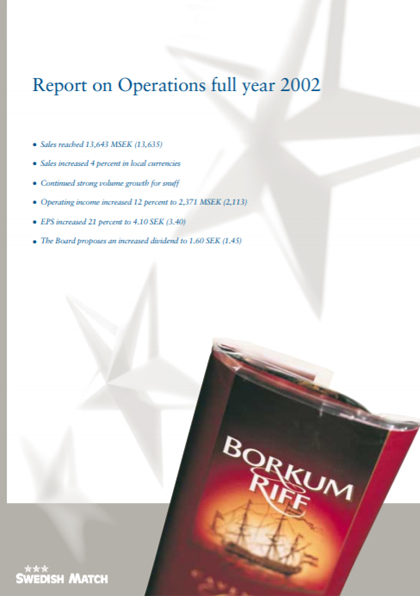
Annual report 2002
Feb 11, 2003 3:06 PM CET
Annual report 2002
Interim reports 2002
Q1
Apr 23, 2002 9:30 AM CET
Report
Q2
Jul 24, 2002 9:54 AM CET
Report
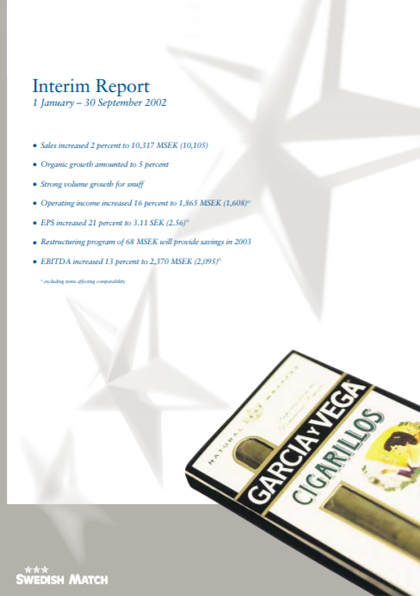
Q3
Oct 24, 2002 9:25 AM CET
Report
Q4
Feb 11, 2003 10:48 AM CET
Report
2001
Annual report 2001
Apr 12, 2002 2:06 PM CET
Annual report 2001
Interim reports 2001
Q1
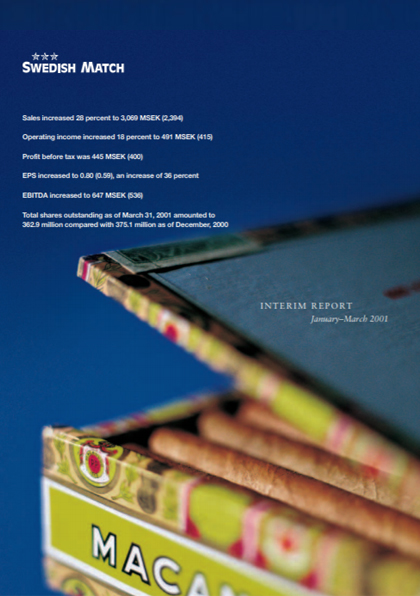
Apr 24, 2001 2:35 PM CET
Report
Q2
Jul 24, 2001 2:30 PM CET
Report
Q3
Oct 23, 2001 9:28 AM CET
Report
Q4
Feb 12, 2002 11:18 AM CET
Report
2000
Annual report 2000
Feb 8, 2001 3:06 PM CET
Annual report 2000
Interim reports 2000
Q1
Apr 27, 2000 2:38 PM CET
Report
Q2
Jul 25, 2000 2:38 PM CET
Report
Q3
Oct 26, 2000 2:39 PM CET
Report
Q4
Feb 8, 2001 2:40 PM CET
Report
1999
Annual report 1999
Apr 17, 2000 10:06 AM CET
Annual report 1999
Interim reports 1999
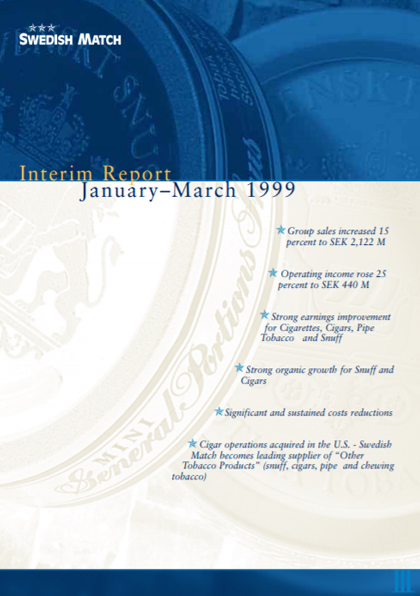
Q1
Apr 26, 1999 2:41 PM CET
Report
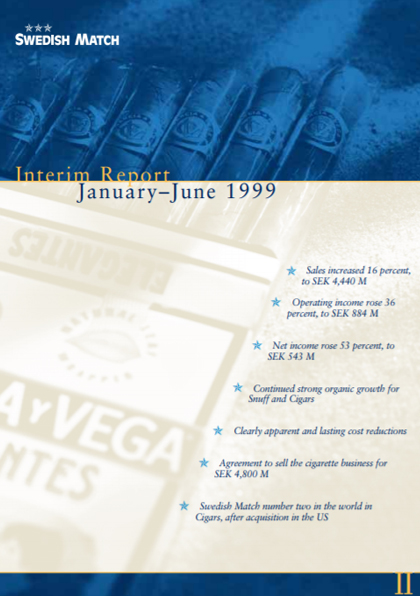
Q2
Jul 27, 1999 3:06 PM CET
Report
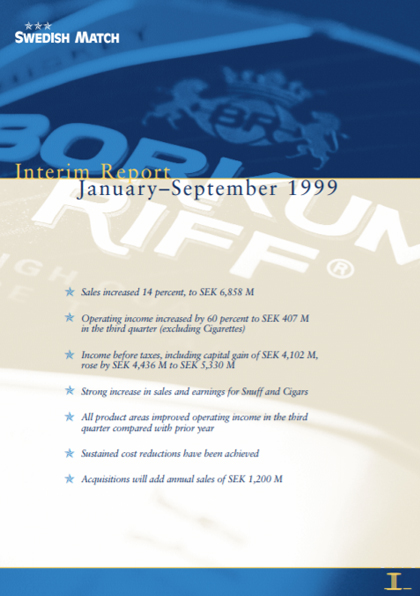
Q3
Oct 29, 1999 2:25 PM CET
Report
Q4
Feb 9, 2000 3:40 PM CET
Report
1998
Annual report 1998
Feb 12, 1999 3:06 PM CET
Annual report 1998
Interim reports 1998
Q1
Apr 29, 1998 11:00 AM CET
Report
Q2
Aug 10, 1998 2:44 PM CET
Report
Q3
Oct 23, 1998 2:45 PM CET
Report
Q4
Feb 12, 1999 3:46 PM CET
Report
1997
Annual report 1997
Feb 24, 1998 11:06 AM CET
Annual report 1997
Interim reports 1997
Q1
May 6, 1997 2:46 PM CET
Report
Q2
Aug 12, 1997 2:47 PM CET
Report
Q3
Nov 6, 1997 3:48 PM CET
Report
Q4
Feb 24, 1998 12:15 PM CET
Report
1996
Annual report 1996
Mar 3, 1997 3:06 PM CET
Annual report 1996